Application Insights is a powerful and surprisingly flexible application performance monitoring (APM) service hosted in Azure. Every time I've used Application Insights on a project, it has opened the team's eyes to what is happening with our application in production. In fact, this might just be one of the best named Microsoft products ever. It literally provides insights into your applications.

Application Insights has built-in support for .NET, Java, Node.js, Python, and Client-side JavaScript based applications. This blog post is specifically about .NET applications. If you're application is built in another language, head over to the docs to learn more.
Codeless Monitoring vs Code-based Monitoring
With codeless monitoring, you can configure a monitoring tool to run on the server (or service) that is hosting your application. The monitoring tool will monitor running processes and collect whatever information is available for that particular platform. There is built in support for Azure VM and scale sets, Azure App Service, Azure Cloud Services, Azure Functions, Kubernetes applications and On-Premises VMs. Codeless monitoring is a good option if you want to collect information for applications that have already been built and deployed, but you are generally going to get more information using Code-based monitoring.
With code-based monitoring, you add the Application Insights SDK. The steps for adding the SDK are well document for ASP.NET Core, ASP.NET, and .NET Console applications so I don't need to re-hash that here.
If you prefer, I have recorded a video showing how to add Application Insights to an existing ASP.NET Core application.
Telemetry
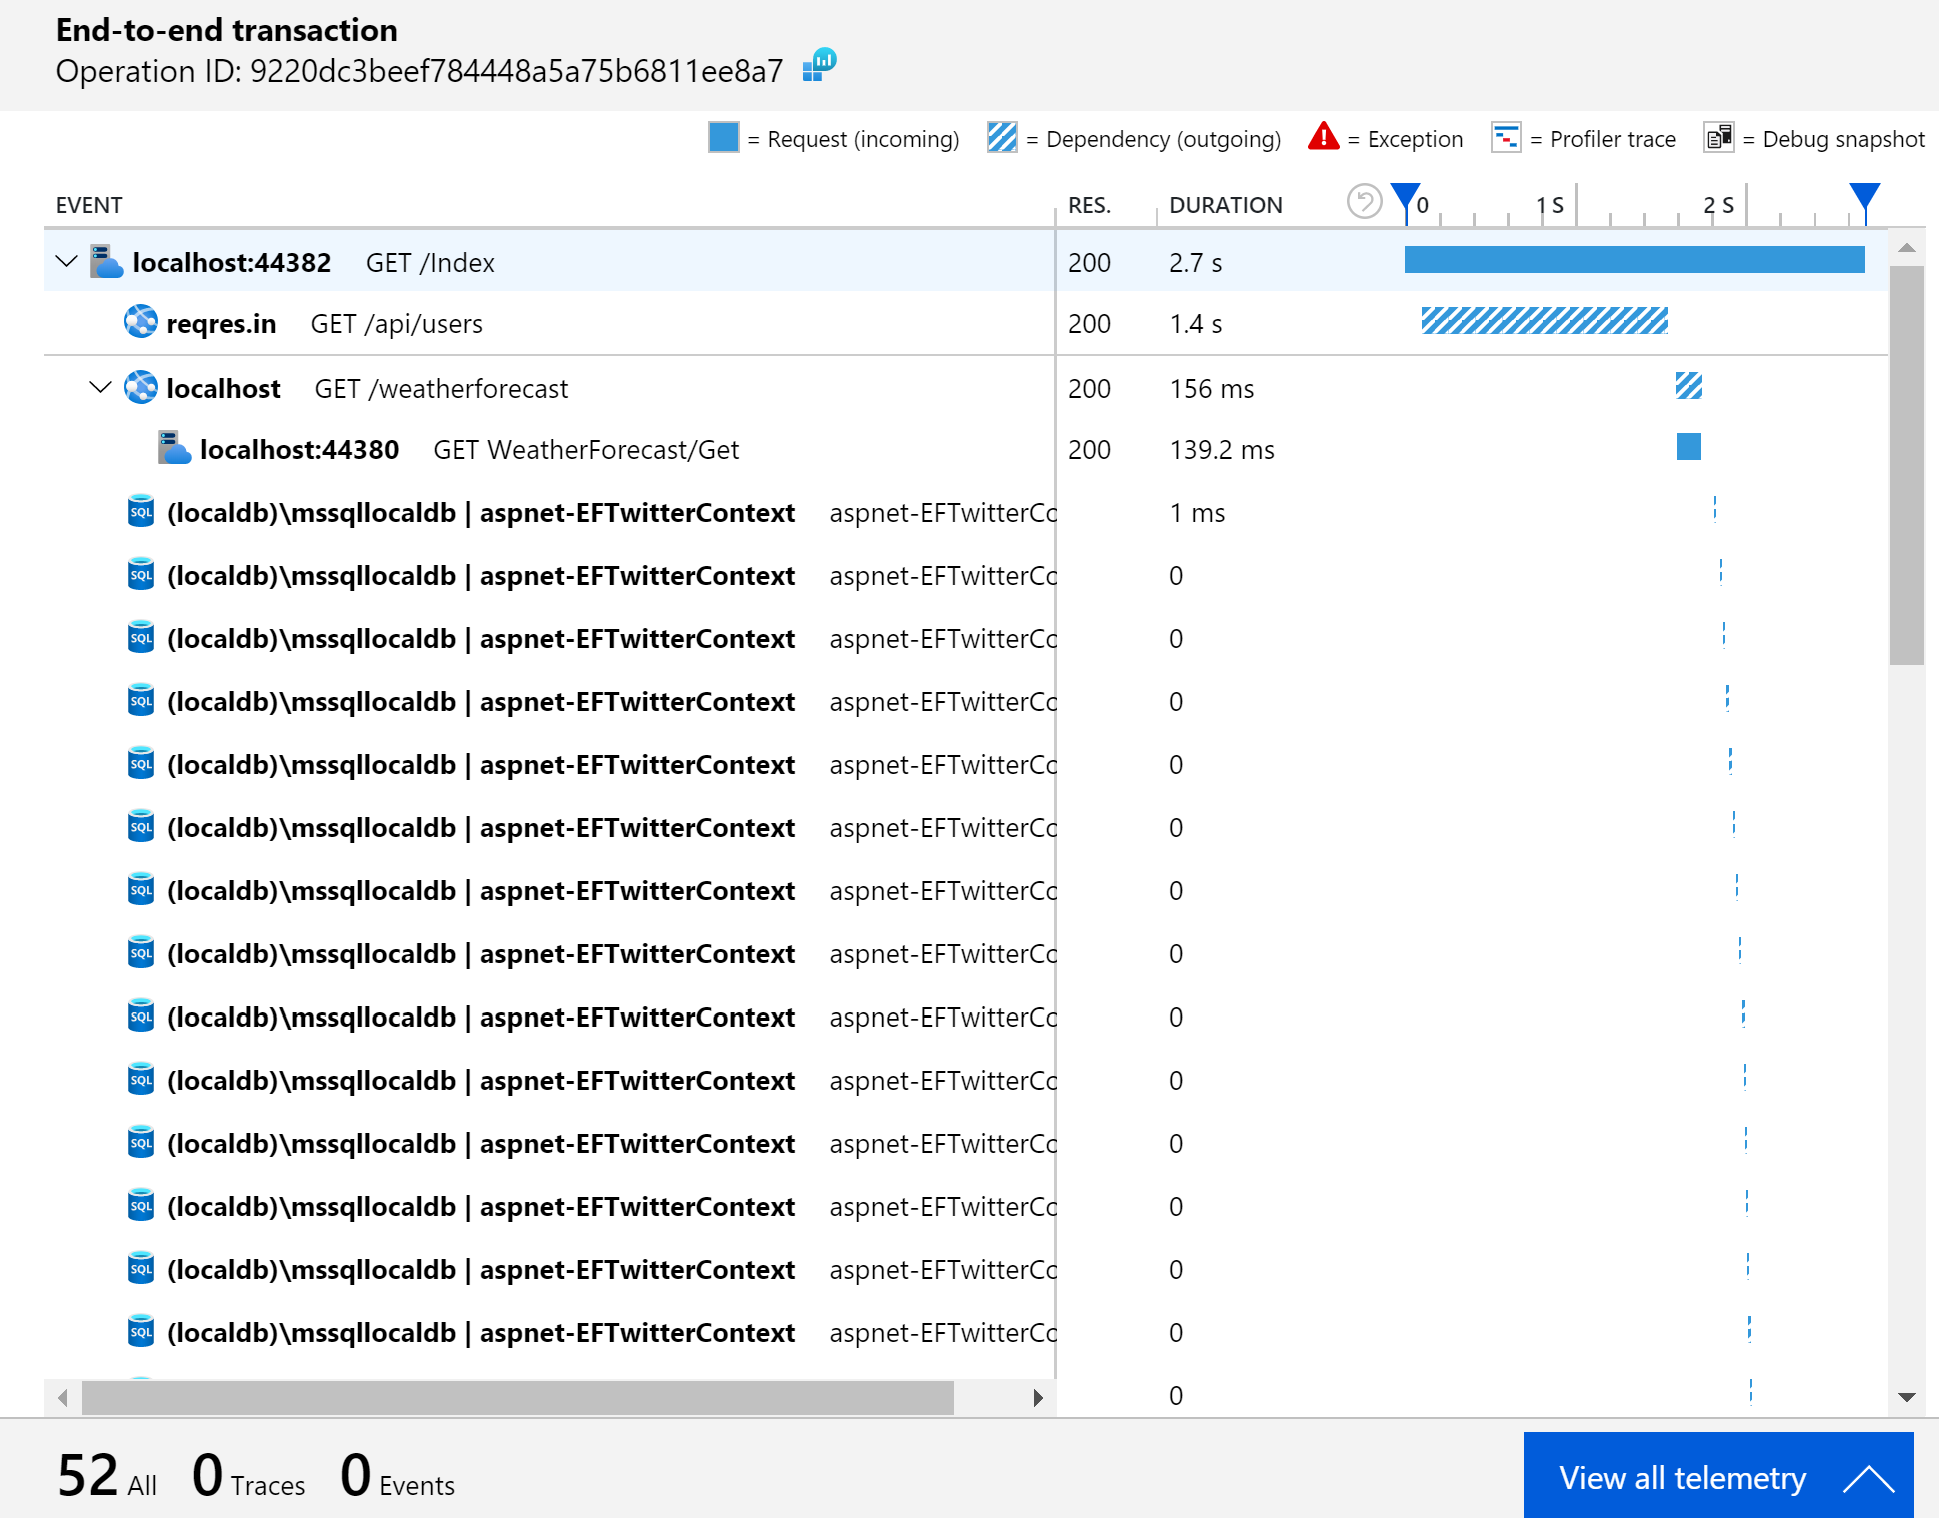
Once you've added the Application Insights SDK to your application, it will start collecting telemetry data at runtime and sending it to Application Insights. That telemetry data is what feeds the UI in the Application Insights portal. The SDK will automatically collection information about your dependencies calls to SQL Server, HTTP calls and calls to many popular Azure Services. It's the dependencies that often are the most insightful. In a complex system it's difficult to know exactly what dependencies your application calls in order to process an incoming request. With App Insights, you can see exactly what dependencies are called by drilling in to the End-to-End Transaction view.

In addition to dependencies, the SDK will also collect requests, exceptions, traces, customEvents, and performanceCounters. If your application has a web front-end and you add the JavaScript client SDK, you'll also find pageViews and browserTimings.
Separate your Environments
The SDK decides which Application Insights instance to send the collected telemetry based on the configured Instrumentation Key.
In the ASP.NET Core SDK, this is done through app settings:
1 | { |
When you're diagnosing an issue in production or investigating performance in your production systems, you don't want any noise from your development or staging environments. I always recommend creating an Application Insights resource per environment. In the Azure Portal, you'll find the instrumentation key in the top section of the Overview page for your Application Insights resource. Just grab that instrumentation key and add it to your environment specific configuration.
Use a single instance for all your production services
Consider a micro-services type architecture where your application is composed of a number of services, each hosted within it's own process. It might be tempting to have each service point to a separate instance of Application Insights.
Contrary to the guidance of separating your environments, you'll actually get the most value from Application Insights if you point all your related production services to a single Application Insights instance. The reason for this is that Application Insights automatically correlates telemetry so you can track a particular request across a series of separate services. That might sound a little like magic but it's not actually as complicated as it sounds.
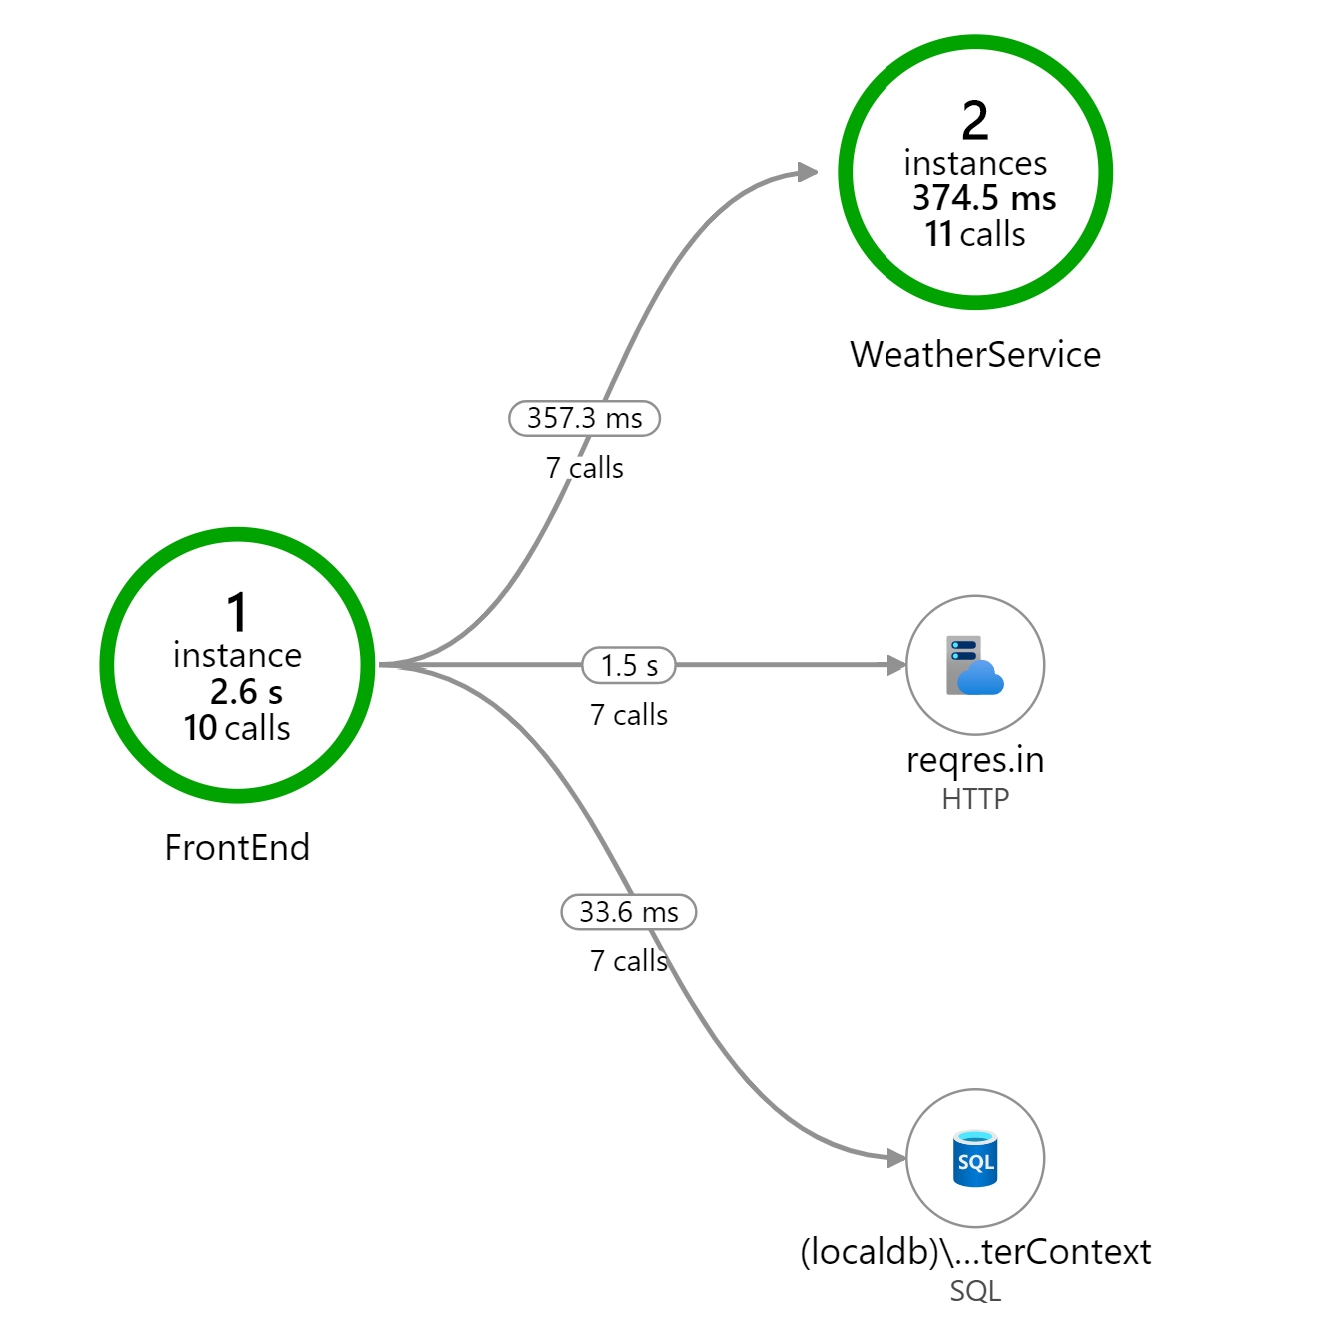
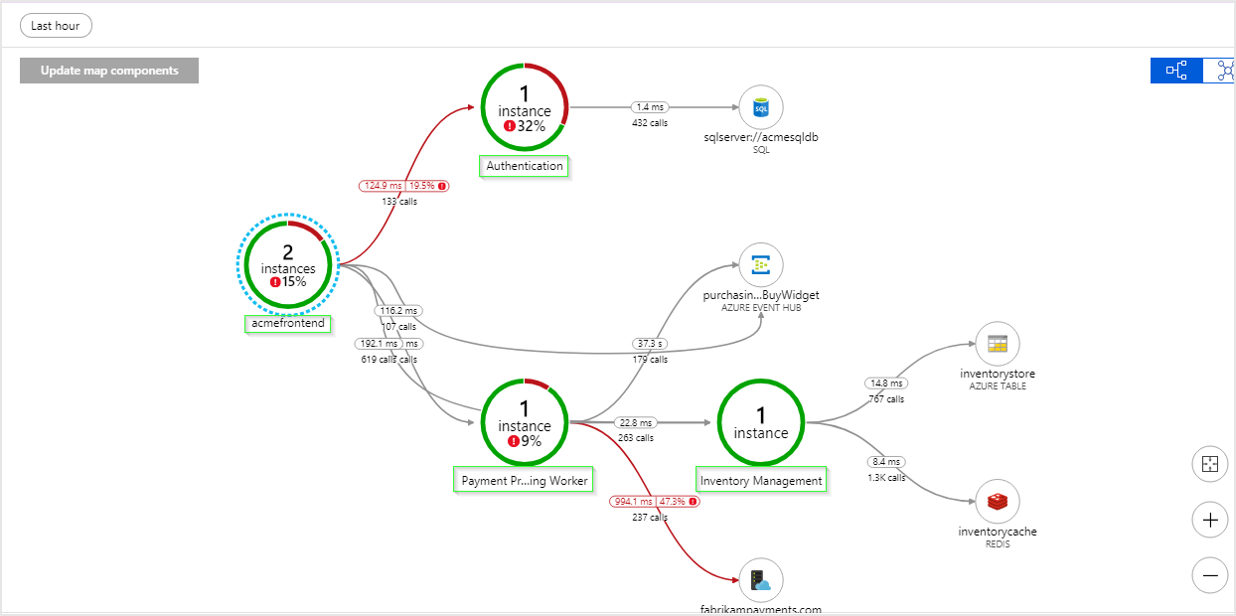
It's this correlation that allows the Application Map in App Insights to show exactly how all your services interact with each other.

It also enables the end-to-end transaction view to show a timeline of all the calls between your services when you are drilling in to a specific request.
This is all contingent on all your services sending telemetry to the same Application Insights instance. The Application Insights UI in the Azure Portal has no ability to display this visualizations across multiple Application Insights instances.
You don't need to be on Azure
I've often heard developers say "I can't use Application Insights because we're not on Azure". Well, you don't need to host your application on Azure to use Application Insights. Yes, you will need an Azure subscription for the Application Insights resource, but your application can be hosted anywhere. That includes your own on-premise services, AWS or any other public/private cloud.
Next Steps
Out of the box, Application Insights provides a tremendous amount of value but I always find myself having to customize a few things to really get the most out of the telemetry. Fortunately, the SDK provides some useful extension points. My plan is to follow up this post with a few more posts that go over those customizations in detail. I also have started to create a NuGet package to simplify those customizations so stay tuned!
*Update
Other posts in this series: Setting Cloud Role Name Enhancing Application Insights Request Telemetry
